Ray Tracing Harmonic Functions
Best Paper (Honorable Mention) top 1.5% of submissions.
pdf (11.2 mb) code (ShaderToy) video (10 min) supplement (350 kb) video (2 min) video (30 min) code (C++) poster (13 mb) doi
Sphere tracing is a fast and high-quality method for visualizing surfaces encoded by signed distance functions (SDFs). We introduce a similar method for a completely different class of surfaces encoded by harmonic functions, opening up rich new possibilities for visual computing. Our starting point is similar in spirit to sphere tracing: using conservative Harnack bounds on the growth of harmonic functions, we develop a Harnack tracing algorithm for visualizing level sets of harmonic functions, including those that are angle-valued and exhibit singularities. The method takes much larger steps than naïve ray marching, avoids numerical issues common to generic root finding methods and, like sphere tracing, needs only perform pointwise evaluation of the function at each step. For many use cases, the method is fast enough to run real time in a shader program. We use it to visualize smooth surfaces directly from point clouds (via Poisson surface reconstruction) or polygon soup (via generalized winding numbers) without linear solves or mesh extraction. We also use it to visualize nonplanar polygons (possibly with holes), surfaces from architectural geometry, mesh "exoskeletons", and key mathematical objects including knots, links, spherical harmonics, and Riemann surfaces. Finally we show that, at least in theory, Harnack tracing provides an alternative mechanism for visualizing arbitrary implicit surfaces.
Paper
Supplement
GLSL Examples
Several examples in the paper were implemented as GLSL shaders in ShaderToy. You can find a complete list here, but below are a few of my favorites: 
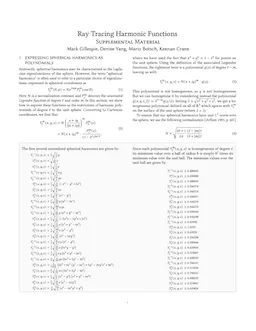
Riemann surfaces are central objects of study in complex analysis. Much of their interesting behavior occurs at singular points, which pose problems for standard techniques, but are accurately resolved by Harnack tracing. 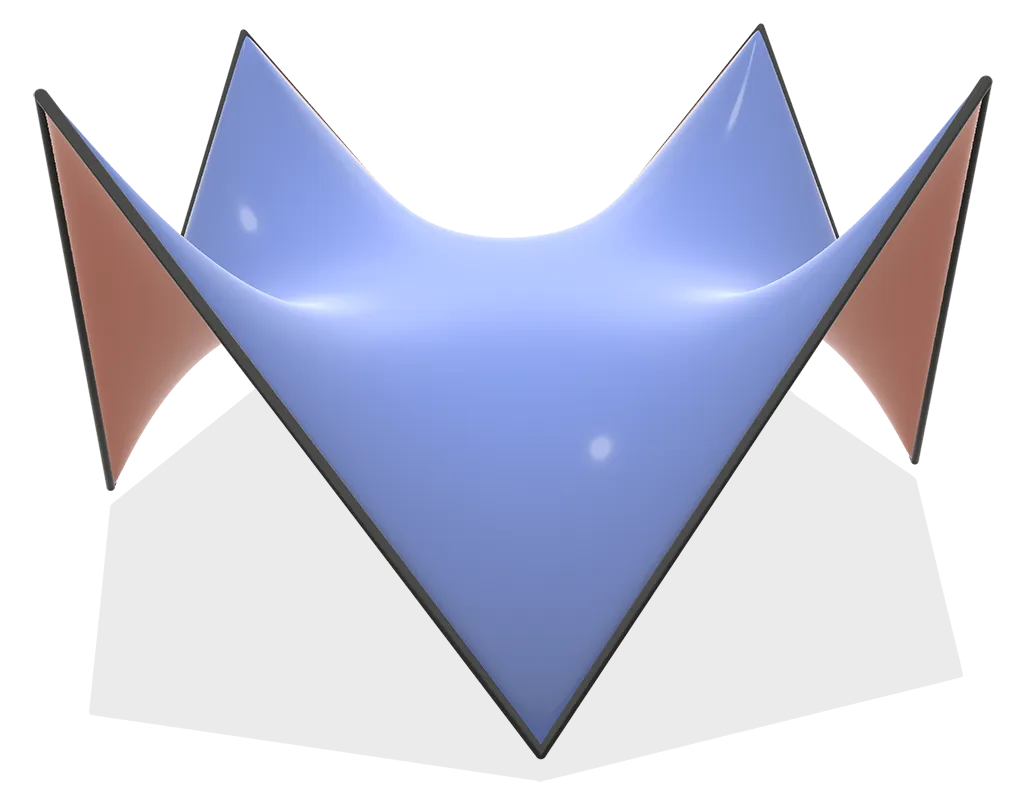
A perennial question in computer graphics is how to interpret polygons whose vertices do not sit in a common plane. The ability to ray trace harmonic functions provides an elegant answer: we can visualize a nonplanar polygon as a level set of a harmonic function naturally associated to the polygon, namely, its (signed) solid angle. 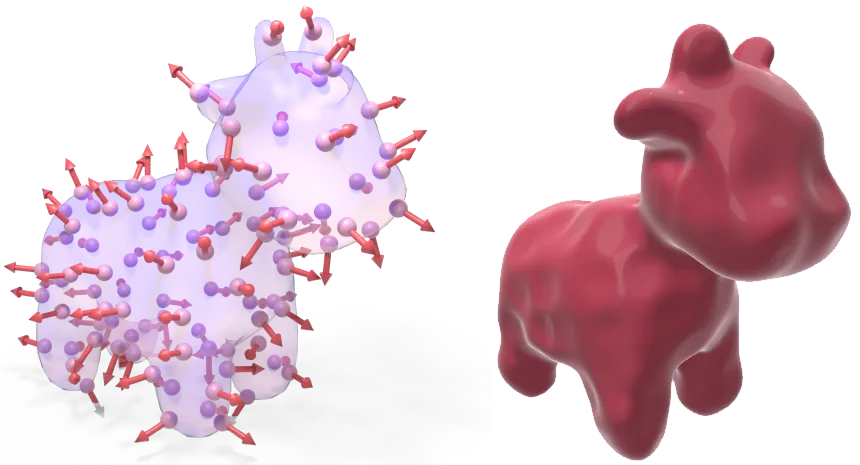
Given an oriented point cloud (left), we can directly visualize an interpolating surface (right). This procedure effectively shows the result of running the Poisson surface reconstruction algorithm of Kazhdan et al. [2006], without requiring any volumetric meshing or linear solves. 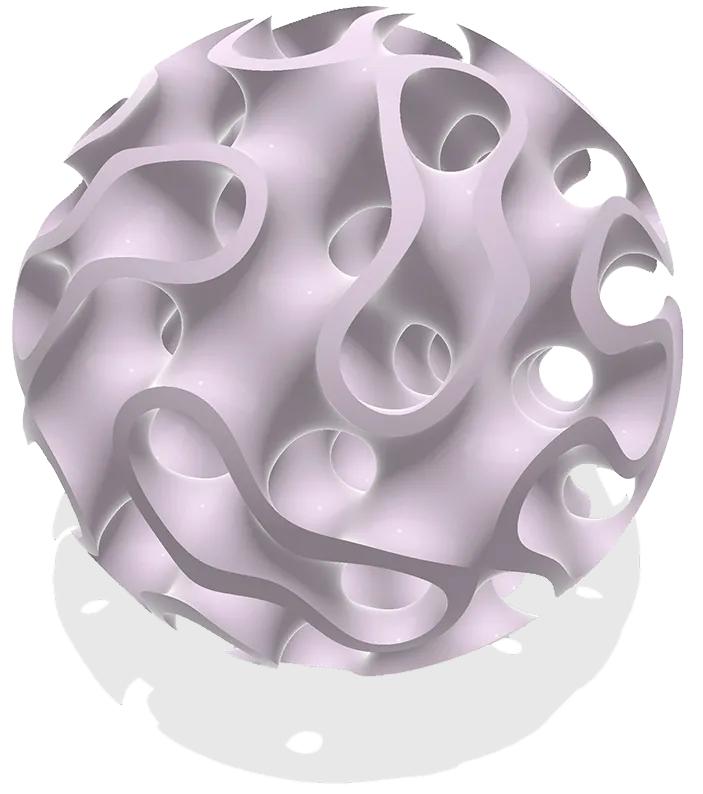
The gyroid is described by the zero level set of the function f(x, y, z) = sin(x) cos(y) + sin(y) cos(z) + sin(z) cos(x). Although this function is not harmonic, we can still ray trace its level sets by constructing a harmonic extension in four dimensions. 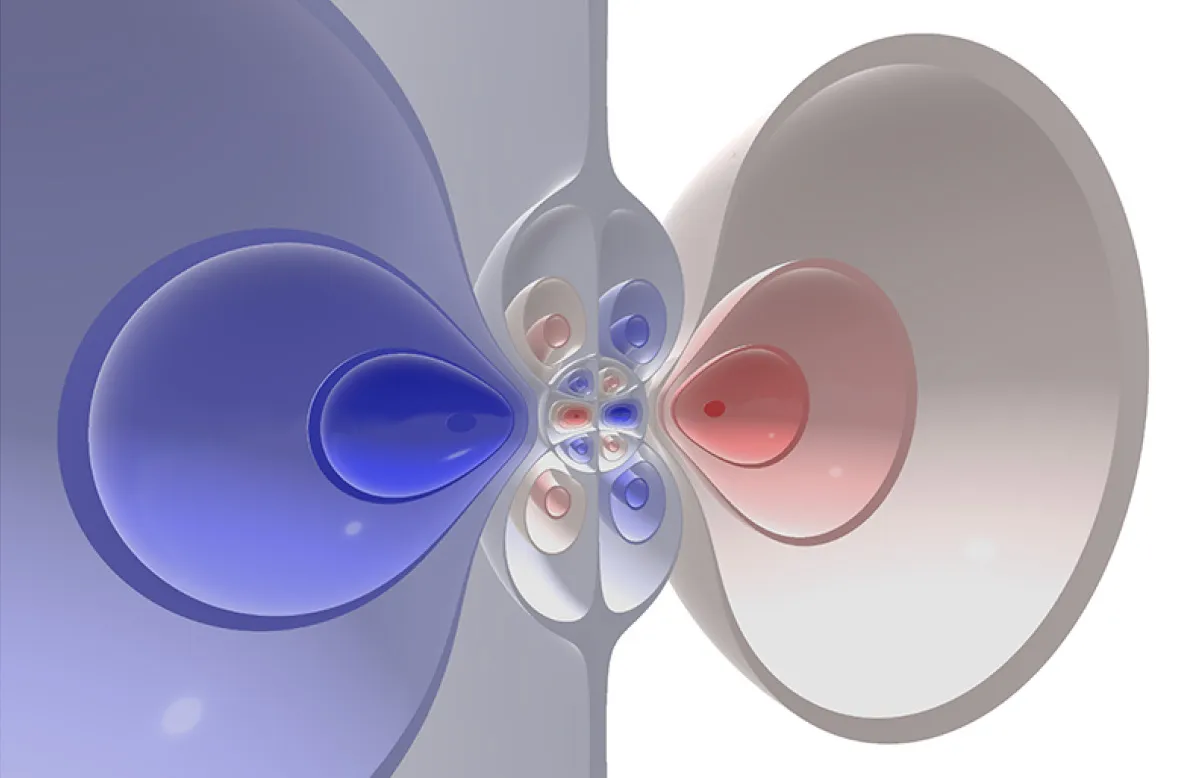
We can also visualize “hyperspherical” harmonics: 4D harmonic polynomials restricted to the 3-sphere and mapped into R³ via stereographic projection.
Riemann Surfaces
https://www.shadertoy.com/view/DlSfWdRiemann surfaces are central objects of study in complex analysis. Much of their interesting behavior occurs at singular points, which pose problems for standard techniques, but are accurately resolved by Harnack tracing.
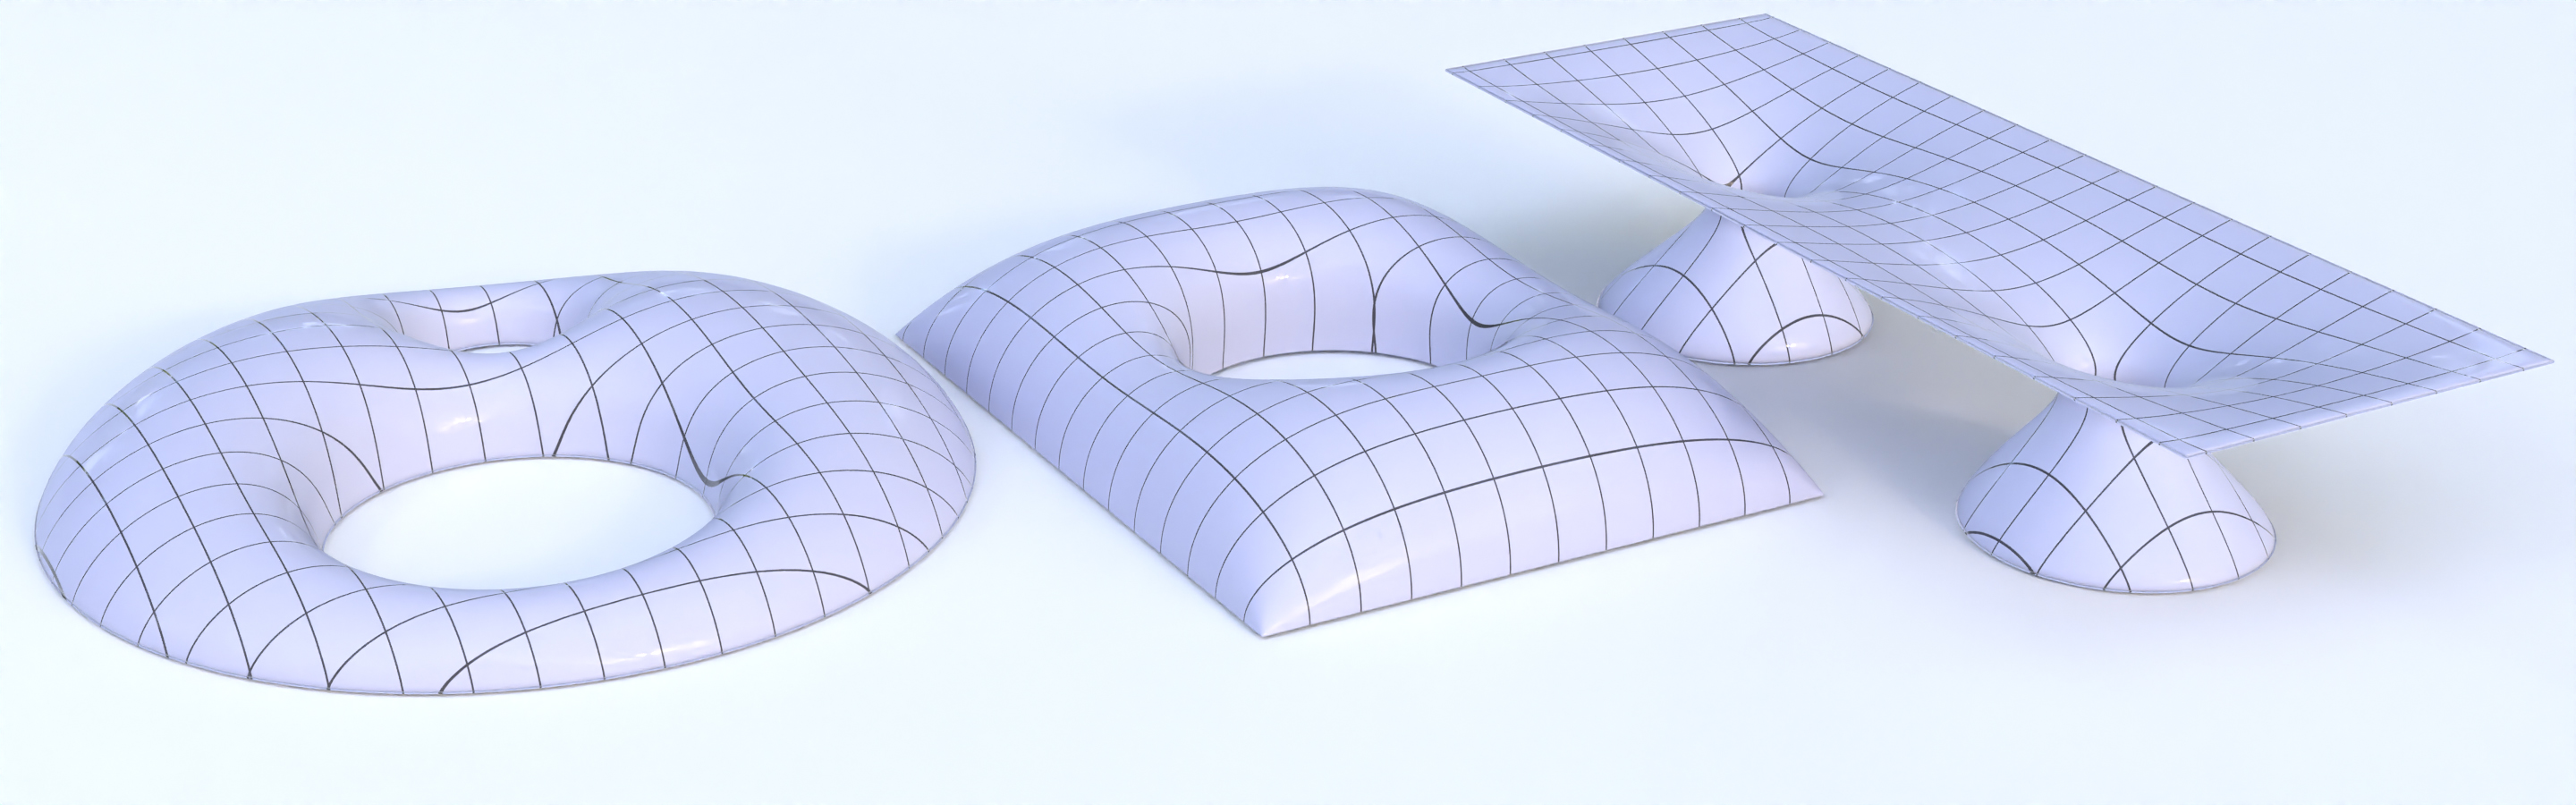
Nonplanar Polygons
https://www.shadertoy.com/view/4cfXWsA perennial question in computer graphics is how to interpret polygons whose vertices do not sit in a common plane. The ability to ray trace harmonic functions provides an elegant answer: we can visualize a nonplanar polygon as a level set of a harmonic function naturally associated to the polygon, namely, its (signed) solid angle.
Point Cloud Reconstruction
https://www.shadertoy.com/view/mtcBDlGiven an oriented point cloud (left), we can directly visualize an interpolating surface (right). This procedure effectively shows the result of running the Poisson surface reconstruction algorithm of Kazhdan et al. [2006], without requiring any volumetric meshing or linear solves.
Gyroid
https://www.shadertoy.com/view/MffGzSThe gyroid is described by the zero level set of the function f(x, y, z) = sin(x) cos(y) + sin(y) cos(z) + sin(z) cos(x). Although this function is not harmonic, we can still ray trace its level sets by constructing a harmonic extension in four dimensions.
Hyperspherical Harmonics
https://www.shadertoy.com/view/DdXyRjWe can also visualize “hyperspherical” harmonics: 4D harmonic polynomials restricted to the 3-sphere and mapped into R³ via stereographic projection.
Bibtex
@article{Gillespie:2024:RTH, author = {Gillespie, Mark and Yang, Denise and Botsch, Mario and Crane, Keenan}, title = {Ray Tracing Harmonic Functions}, journal = {ACM Trans. Graph.}, volume = {43}, number = {4}, year = {2024}, publisher = {ACM}, address = {New York, NY, USA}, doi = {10.1145/3658201}, month = jul, articleno = {99}, pages = {1--18} }
Acknowledgements
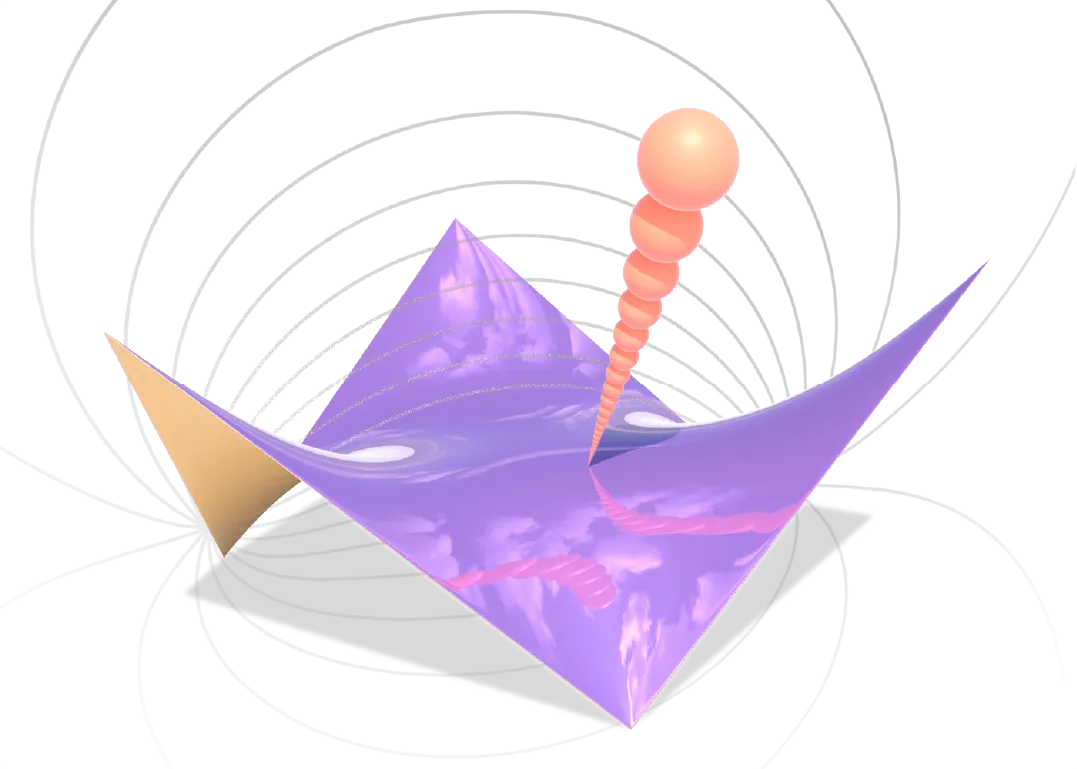
Thanks to Nicole Feng for help with Biot-Savart-based expressions for our surface normals, to Albert Chern for helpful discussion of the Biot-Savart law and random projections of curves, and to Andrea Tagliasacchi and Google Brain for supporting this work. Figure 2 is based on an illustration by the last author. This work was funded by an NSF CAREER Award (IIS 1943123), NSF Award IIS 2212290, a Packard Fellowship and a gift from Google Brain.
Selected Figures

Our nonplanar polygon definition automatically applies to difficult cases like polygons with holes (left), or knotted boundaries (right)
Given an oriented point cloud (left), we can directly visualize an interpolating surface (right). This procedure effectively shows the result of running the Poisson surface reconstruction algorithm of Kazhdan et al. [2006], without requiring any volumetric meshing or linear solves.

Given a sparse "exoskeleton" approximating a surface (top left) we can directly ray trace an interpolating surface (top right). The resulting image is both higher-quality than the simple triangulation used by most mesh viewers (bottom left), and much simpler to compute than optimizing a mesh-based minimal surface, as originally proposed by de Goes et al. [2011].

Given a surface mesh with imperfections such as holes (left), we can directly visualize the repaired surface defined via the generalized winding number (right), reproducing the example from Jacobson et al. [2013, Figure 1].
Here we use Harnack tracing to directly visualize a special class of grid shells used in architecture, reproducing examples from Adiels [2022] figures 11, 12, and 22 (resp.). To do so, we extend our algorithm to handle circular holes in addition to polygons.